
Aggregation / SUM
One of the most common tasks in any financial model is rolling monthly figures up into Quarters, Halves and a Full Year. In Excel this is done with SUM formulas that are written and dragged across every row. In MODLR the same result comes from the Time Dimension hierarchy itself, with no formula required.
Summing in Excel
To roll up monthly figures in Excel, a formula has to be written for each level of aggregation, and then copied (dragged) across every row in the sheet.
Summing a Quarter
A Quarter is built with a SUM across its three months, for example =SUM($B2:$D2) for Q1.

Summing a Half
A Half is then built by adding its two Quarters together, for example =N2+O2 for H1 (Q1 + Q2).

Summing a Full Year
The Full Year repeats the pattern again, adding the two Halves together with =R2+S2.

Three different formulas, each written once and then dragged down (or across) every row - Revenue, COGS, Gross Profit - and repeated for every reporting period.
Aggregation in MODLR
The Time Dimension
In MODLR, Quarters, Halves and the Full Year are not calculated with formulas at all - they are elements in the Time Dimension hierarchy. 2026 is built up from H1 and H2, each Half is built from two Quarters, and each Quarter is built from its three months.
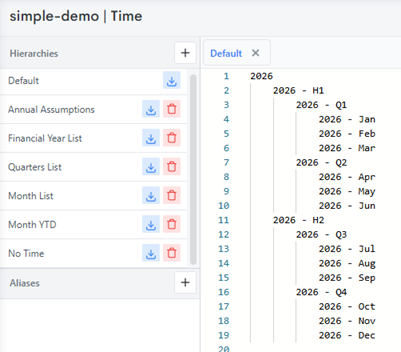
Because this structure is defined once on the Dimension, every Cube that uses the Time Dimension automatically inherits it - there is nothing to build per-cube or per-row.
Summing by MODLR Time
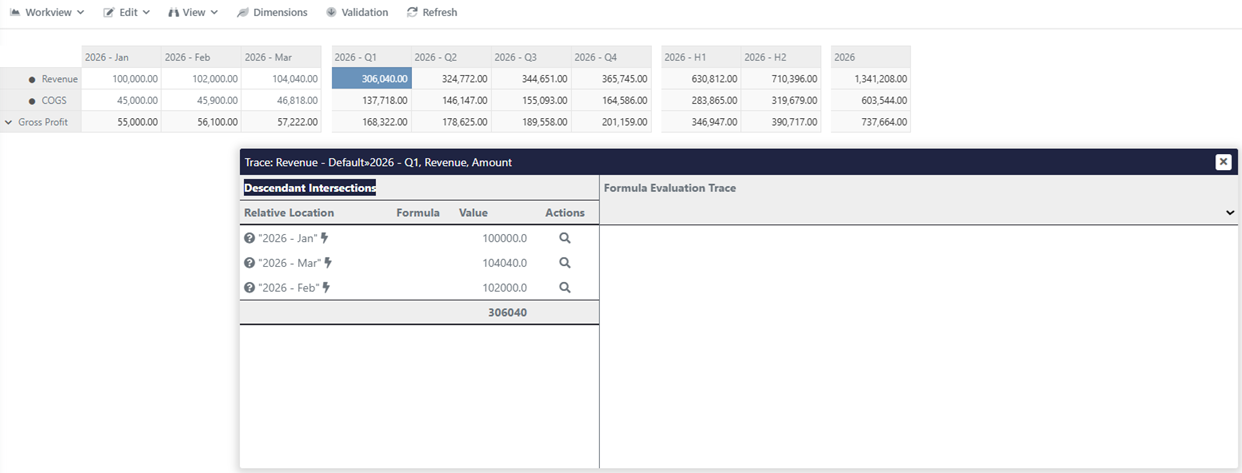
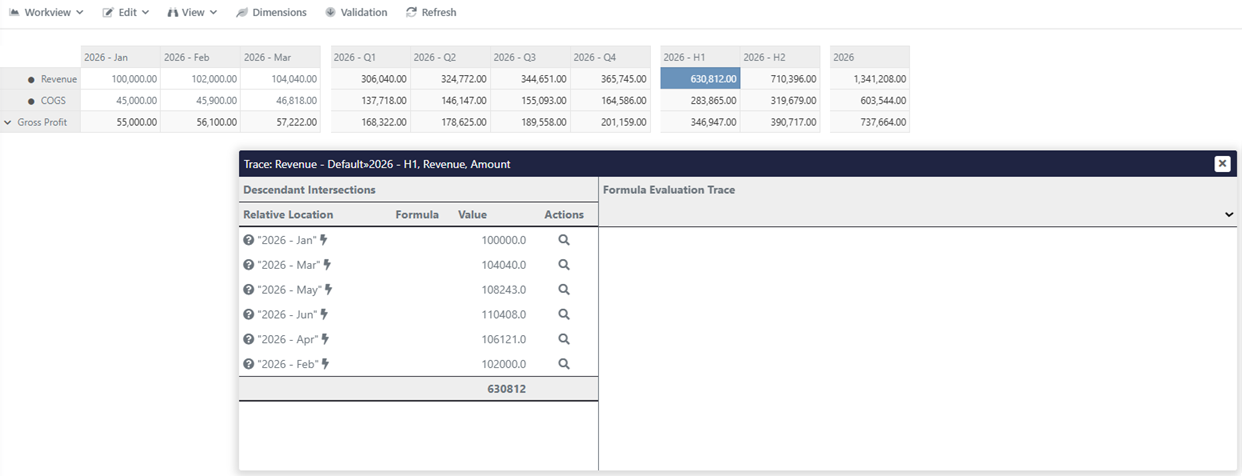
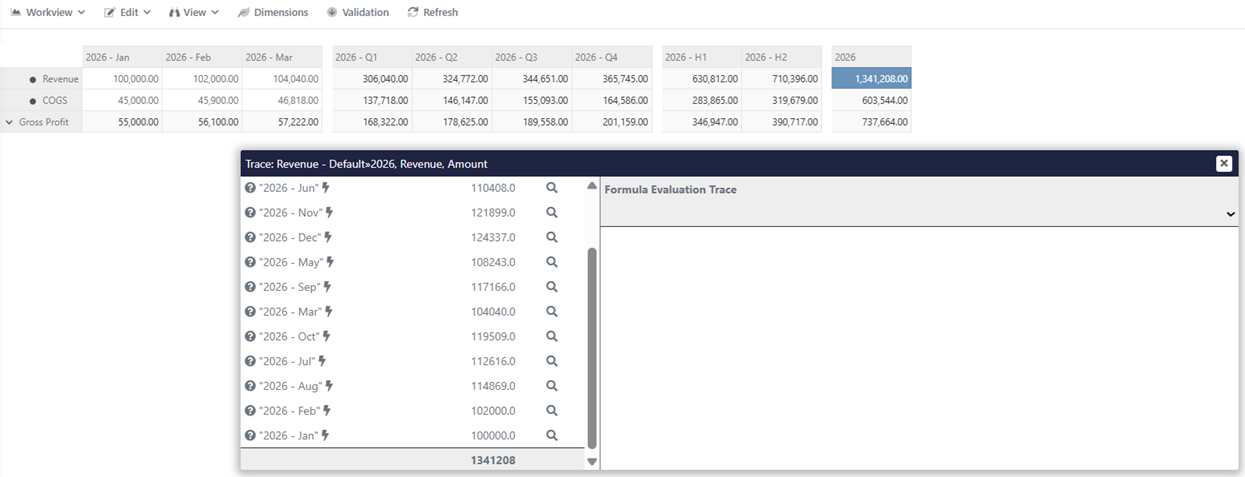
With the hierarchy in place, MODLR aggregates every parent element automatically. Selecting any Quarter, Half or the Full Year in a Workview shows the correct total with no formula behind it at all - the Formula Tracer confirms the value comes directly from summing the child months.
Quarter - 2026 - Q1 is the automatic sum of Jan, Feb and Mar:
Half - 2026 - H1 is the automatic sum of Jan through Jun:
Full Year - 2026 is the automatic sum of all twelve months:
The same aggregation in Excel, via MODLR
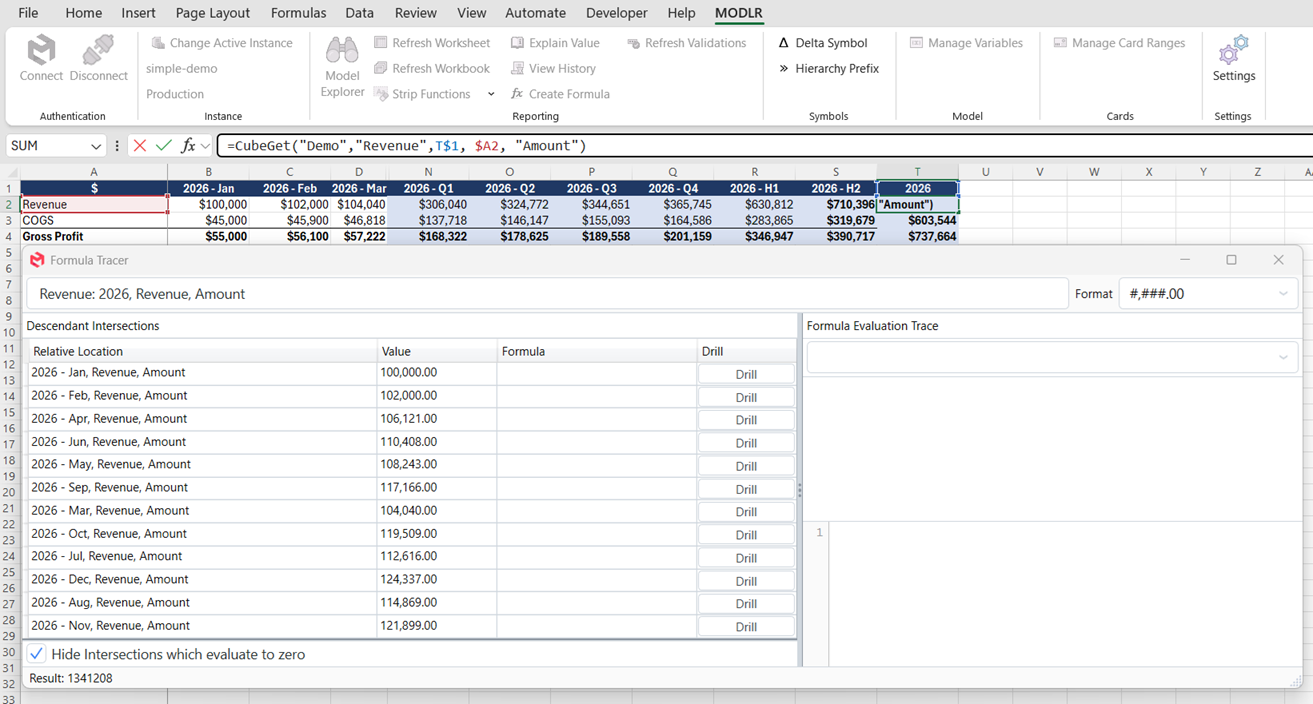
The MODLR Excel Add-in gives access to this same aggregated value directly from Excel. A single CubeGet formula pulls the Full Year figure straight from the model - there is no SUM, no dragging, and no separate Quarter or Half formulas to maintain. The Formula Tracer shows the value is still built from the twelve underlying months inside MODLR, not from any formula in the spreadsheet.
Extending the example to other Dimensions
Account Dimension
The same automatic aggregation isn't limited to the Time Dimension - it applies to every Dimension in MODLR. The Account Dimension is a good example: the same set of underlying accounts can be rolled up in completely different ways, without duplicating a single formula.
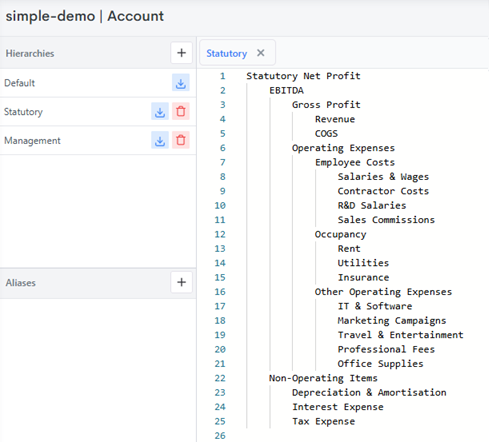
A Dimension can hold as many Hierarchies as needed, and each one groups the underlying elements however makes sense for its audience. Here, the Account Dimension has a Statutory Hierarchy, which groups costs by their nature - Employee Costs, Occupancy, Other Operating Expenses:
...and a Management Hierarchy, grouping those same accounts by function instead - Sales & Marketing, G&A and R&D:
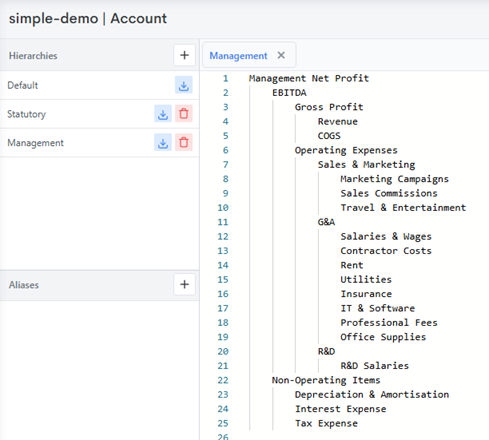
Both Hierarchies are built from the same leaf-level accounts and both roll up to EBITDA and Net Profit - only the grouping in between changes. In Excel, producing a Statutory view and a Management view of the same P&L means maintaining two separate blocks of rows and SUM formulas, both of which need updating every time an account is added or moved. In MODLR, it's simply a second Hierarchy on the same Dimension - the aggregation is defined once per Hierarchy, so as many views as are useful can exist side by side.
Date Dimension
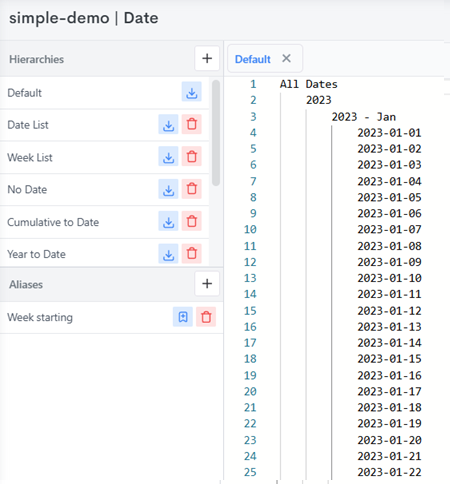
A Date Dimension built down to the individual day shows the same idea again, this time with two Hierarchies that group the same dates by entirely different calendars. The Default Hierarchy rolls individual dates up into Months and then Years:
...while the Week List Hierarchy groups those same dates into Weeks instead, each week starting wherever the data says it should - 2023 - Wk 1 here runs from 2023-01-02 to 2023-01-08, regardless of month or year boundaries:
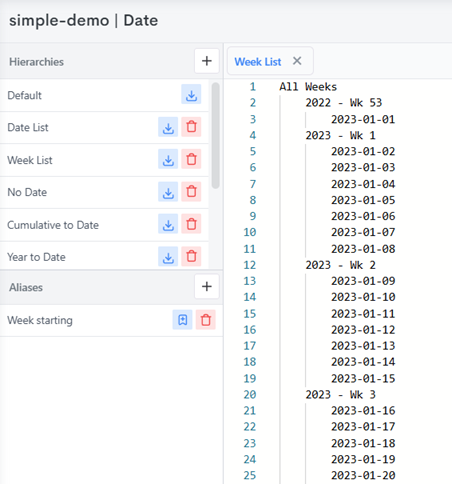
Building a Week-based rollup like this in Excel means a formula structure that doesn't line up with the Month/Quarter/Year one used everywhere else in the workbook - weeks don't divide evenly into months, and a week can even straddle a year-end. In MODLR, it's still just another Hierarchy on the Date Dimension: the days aggregate up to Weeks exactly as automatically as they aggregate up to Months, with no formula having to reconcile the two calendars.
Illustrating the improvement
Dragging SUM formulas across a sheet is one of the most common sources of error in Excel models: a range that isn't extended when a new row is inserted, a formula copied one column too far or too few, or a reference silently left pointing at the wrong cells. Because each Quarter, Half and Full Year in Excel is its own formula, that risk exists at every single level, for every row.
In MODLR, aggregation is defined once, on the Dimension hierarchy - there is no formula to drag and nothing to break by copying it incorrectly.
This also changes what happens when new data arrives. If MODLR is connected to the source system, as soon as more data comes through - for example, financials for 2027 - the model rolls on with it. Every Quarter, Half and Full Year total updates automatically, both in the MODLR web interface and in Excel via the Add-in, with:
- No formulas to update or extend to cover the new period.
- No need to re-export a static copy of the data - the Excel Add-in always queries MODLR live.